US Dollar trades steadily, ignoring weak industrial data from China and Japan
- The US Dollar trades broadly stable in very calm holiday trading
- Monthly Industrial Production in Japan fell by 2.3%, less than the expected 3.5%, while big Chinese manufacturers also reported falling profits.
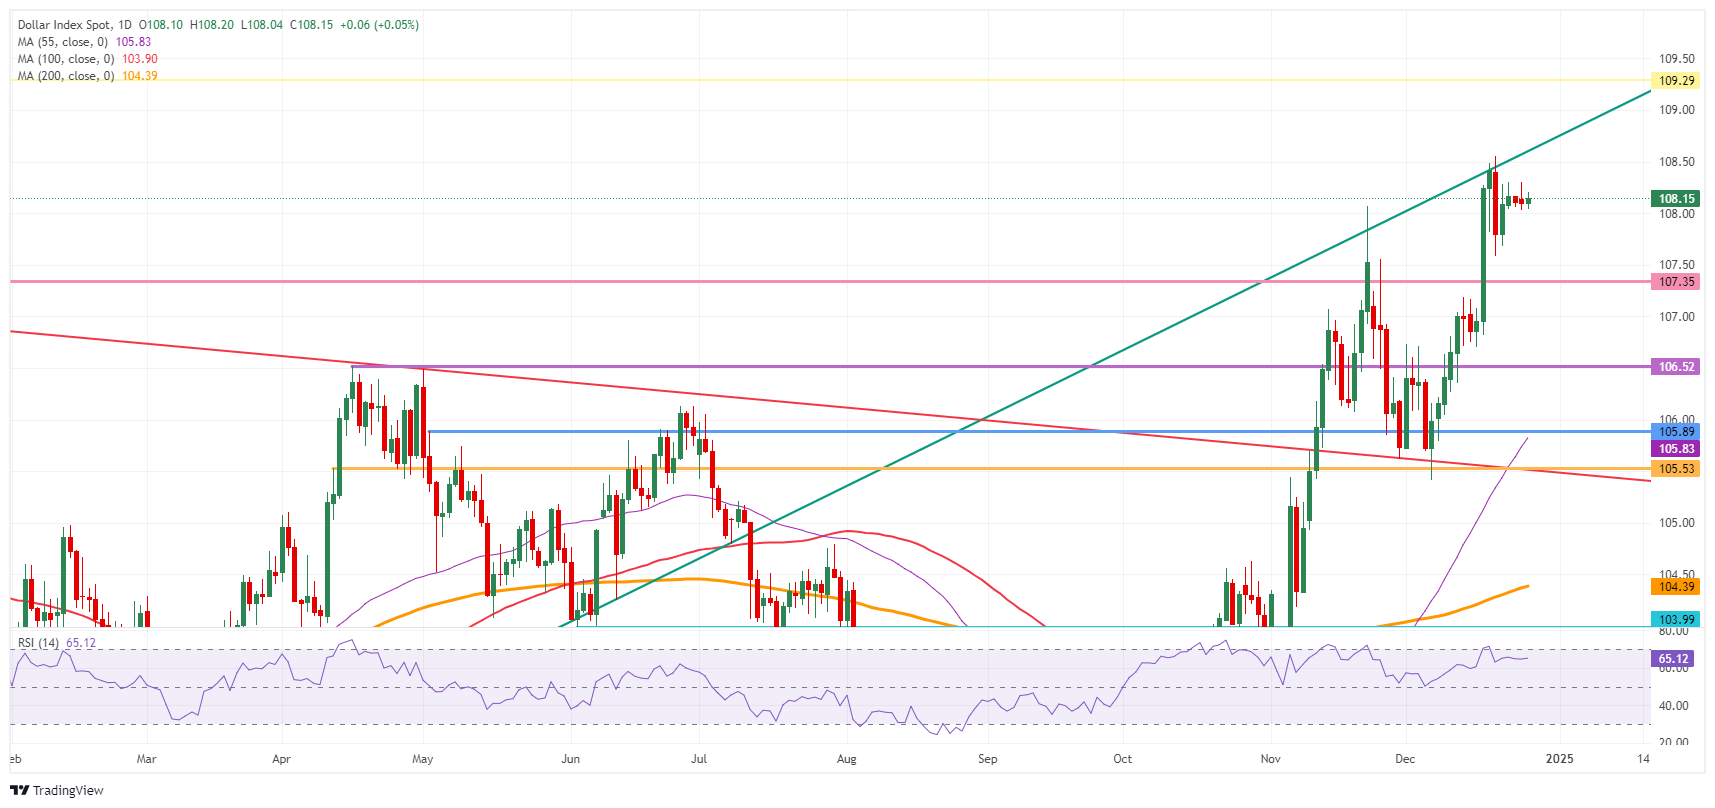
- The US Dollar Index (DXY) resides at 108.00, close to a two-year high.
The US Dollar (USD) is trading within a very tight range on Friday, with the DXY index holding above 108.00, as markets remain cautious and trading desks are short-staffed due to the Christmas holiday. The Dollar failed to react to more action in Asian markets, with data signaling further contraction in Japan’s Industrial Production and Chinese industrial companies reporting lower profits.
The US economic calendar is very light on Friday, with the preliminary Goods Trade Balance and the Wholesale Inventories data. Not much movement is expected from these data points. So a rather steady trading session is expected.
Daily digest market movers: Markets indigestion
- At 13:30 GMT both data points from the US for this Friday will be released:
- The November Goods Trade Balance is expected to show a widening deficit of 100.9 billion USD against the previous 98.7 billion USD deficit.
- November Wholesale Inventories are expected to grow at a stable 0.2%.
- Equities trade mixed on Friday, with all US equity futures trading in the red before the opening bell.
- The CME FedWatch Tool for the first Fed meeting of 2025 on January 29 sees an 89.3% chance for a stable policy rate against a small 10.7% chance for a 25 basis points rate cut.
- The US 10-year benchmark rate trades at 4.60%, not far from this week’s high at 4.64%.
US Dollar Index Technical Analysis: Not much going on
The US Dollar Index (DXY) is not expected to attack any firm levels this Friday given the low liquidity and only a handful of market participants present between Christmas and New Year. Any big movements aren’t expected unless an outside event takes place on the geopolitical front. It looks like the DXY will head into New Year’s Eve trading just above 108.00.
On the upside, a trend line originating from December 28, 2023, is acting as a moving cap. The next firm resistance comes in at 109.29, which was the peak of July 14, 2022, and has a good track record as a pivotal level. Once that level is surpassed, the 110.00 round level comes into play.
The first downside barrier comes in at 107.35, which has now turned from resistance into support. The second level that might be able to halt any selling pressure is 106.52. From there, even 105.53 could come under consideration while the 55-day Simple Moving Average (SMA) at 105.83 is making its way up to that level.
US Dollar Index: Daily Chart
US Dollar FAQs
The US Dollar (USD) is the official currency of the United States of America, and the ‘de facto’ currency of a significant number of other countries where it is found in circulation alongside local notes. It is the most heavily traded currency in the world, accounting for over 88% of all global foreign exchange turnover, or an average of $6.6 trillion in transactions per day, according to data from 2022. Following the second world war, the USD took over from the British Pound as the world’s reserve currency. For most of its history, the US Dollar was backed by Gold, until the Bretton Woods Agreement in 1971 when the Gold Standard went away.
The most important single factor impacting on the value of the US Dollar is monetary policy, which is shaped by the Federal Reserve (Fed). The Fed has two mandates: to achieve price stability (control inflation) and foster full employment. Its primary tool to achieve these two goals is by adjusting interest rates. When prices are rising too quickly and inflation is above the Fed’s 2% target, the Fed will raise rates, which helps the USD value. When inflation falls below 2% or the Unemployment Rate is too high, the Fed may lower interest rates, which weighs on the Greenback.
In extreme situations, the Federal Reserve can also print more Dollars and enact quantitative easing (QE). QE is the process by which the Fed substantially increases the flow of credit in a stuck financial system. It is a non-standard policy measure used when credit has dried up because banks will not lend to each other (out of the fear of counterparty default). It is a last resort when simply lowering interest rates is unlikely to achieve the necessary result. It was the Fed’s weapon of choice to combat the credit crunch that occurred during the Great Financial Crisis in 2008. It involves the Fed printing more Dollars and using them to buy US government bonds predominantly from financial institutions. QE usually leads to a weaker US Dollar.
Quantitative tightening (QT) is the reverse process whereby the Federal Reserve stops buying bonds from financial institutions and does not reinvest the principal from the bonds it holds maturing in new purchases. It is usually positive for the US Dollar.

