GBP/USD Price Forecast: Sticks to strong gains near multi-month top, above mid-1.3000s
- GBP/USD attracts buyers for the second consecutive day as the USD slumps to a fresh YTD low.
- Worries about a tariff-driven US economic slowdown lift Fed rate cut bets and weigh on the buck.
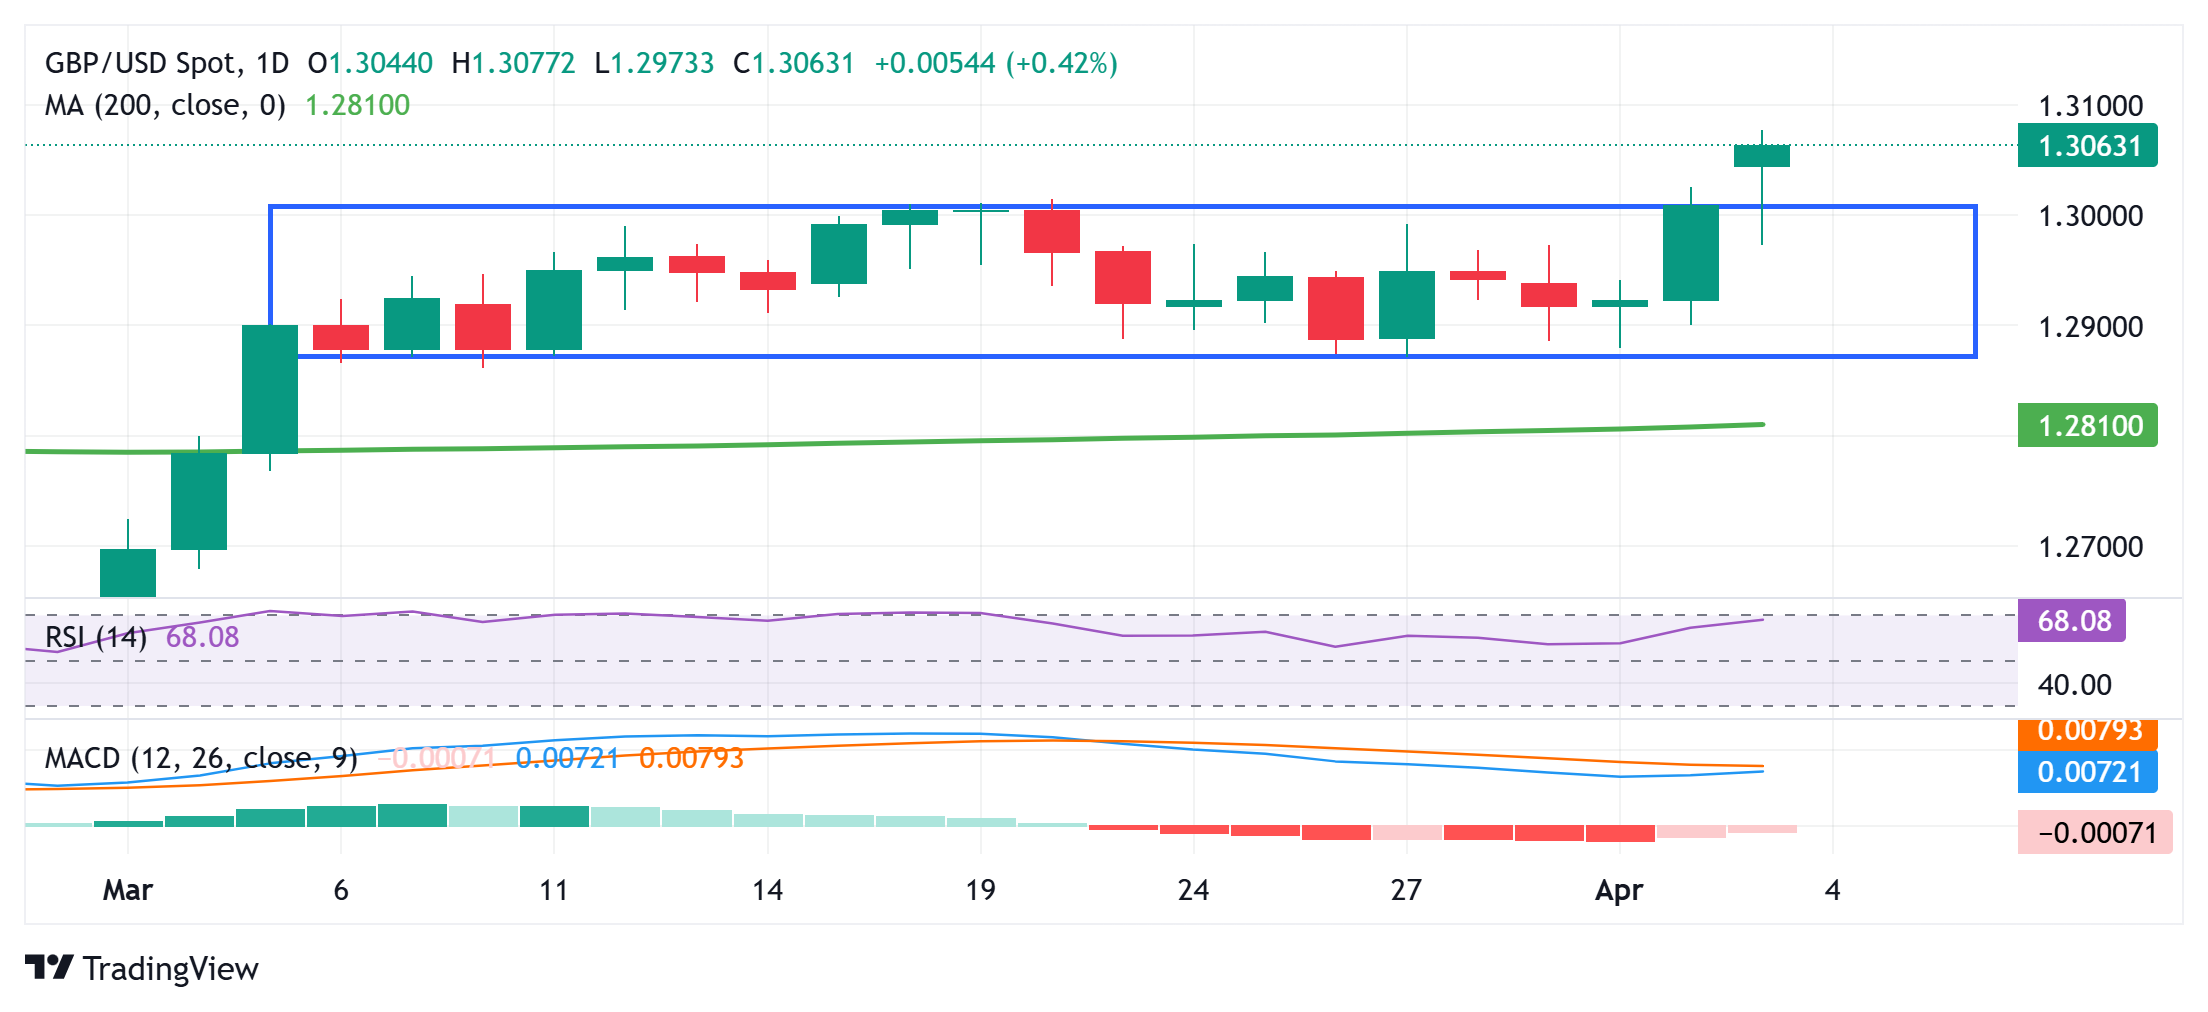
- A breakout through a multi-week-old range supports prospects for further gains for the major.
The GBP/USD pair gains strong follow-through positive traction for the second successive day on Thursday and advances to its highest level since October 2024 during the Asian session. Spot prices currently trade just above mid-1.3000s, up 0.40% for the day, and seem poised to climb further amid a bearish US Dollar (USD).
The USD Index (DXY), which tracks the Greenback against a basket of currencies, dives to a fresh year-to-day low in reaction to US President Donald Trump's trade tariffs, which lifts bets that the Federal Reserve (Fed) will resume its rate-cutting cycle soon. This, along with the anti-risk flow, triggers a steep decline in the US Treasury bond yields and further undermines the buck.
The British Pound (GBP), on the other hand, draws support from expectations that the Bank of England (BoE) will lower borrowing costs more slowly than other central banks, including the Fed. This further contributes to the bid tone surrounding the GBP/USD pair and supports prospects for an extension of a well-established uptrend from the January monthly swing low.
From a technical perspective, an intraday strong move up beyond the 1.3000 psychological mark confirms a breakout through a multi-week-old trading range. Moreover, oscillators on the daily chart are holding comfortably in positive territory and are still away from being in the overbought zone, which, in turn, validates the near-term constructive outlook for the GBP/USD pair.
Hence, some follow-through strength toward reclaiming the 1.3100 round figure, en route to the next relevant hurdle near the 1.3125 region, looks like a distinct possibility. The momentum could extend further beyond the 1.3155 intermediate barrier, towards the 1.3180 region and the 1.3200 mark.
On the flip side, the 1.3000 resistance breakpoint now seems to protect the immediate downside. Any further corrective slide could be seen as a buying opportunity near the 1.2955 region. This next relevant support is pegged near the 1.2900 mark and the 1.2875-1.2870 horizontal zone. A convincing break below the latter might shift the near-term bias in favor of bearish traders and drag the GBP/USD pair to the very important 200-day Simple Moving Average (SMA), currently pegged near the 1.2800 mark.

US Dollar PRICE Today
The table below shows the percentage change of US Dollar (USD) against listed major currencies today. US Dollar was the strongest against the Australian Dollar.
| USD | EUR | GBP | JPY | CAD | AUD | NZD | CHF | |
|---|---|---|---|---|---|---|---|---|
| USD | -0.50% | -0.15% | -1.14% | 0.09% | 0.45% | 0.22% | -0.63% | |
| EUR | 0.50% | 0.10% | -0.63% | 0.62% | 0.98% | 0.74% | -0.11% | |
| GBP | 0.15% | -0.10% | -0.73% | 0.52% | 0.90% | 0.64% | -0.26% | |
| JPY | 1.14% | 0.63% | 0.73% | 1.21% | 1.63% | 1.23% | 0.48% | |
| CAD | -0.09% | -0.62% | -0.52% | -1.21% | 0.45% | 0.12% | -0.77% | |
| AUD | -0.45% | -0.98% | -0.90% | -1.63% | -0.45% | -0.24% | -1.13% | |
| NZD | -0.22% | -0.74% | -0.64% | -1.23% | -0.12% | 0.24% | -0.90% | |
| CHF | 0.63% | 0.11% | 0.26% | -0.48% | 0.77% | 1.13% | 0.90% |
The heat map shows percentage changes of major currencies against each other. The base currency is picked from the left column, while the quote currency is picked from the top row. For example, if you pick the US Dollar from the left column and move along the horizontal line to the Japanese Yen, the percentage change displayed in the box will represent USD (base)/JPY (quote).
