24 Jul 2019
USD/JPY technical analysis: 4H 200MA, short-term support line limits immediate downside
- USD/JPY struggles between 38.2% Fibonacci retracement and key support confluence.
- An upside break can challenge 2-month old resistance-line.
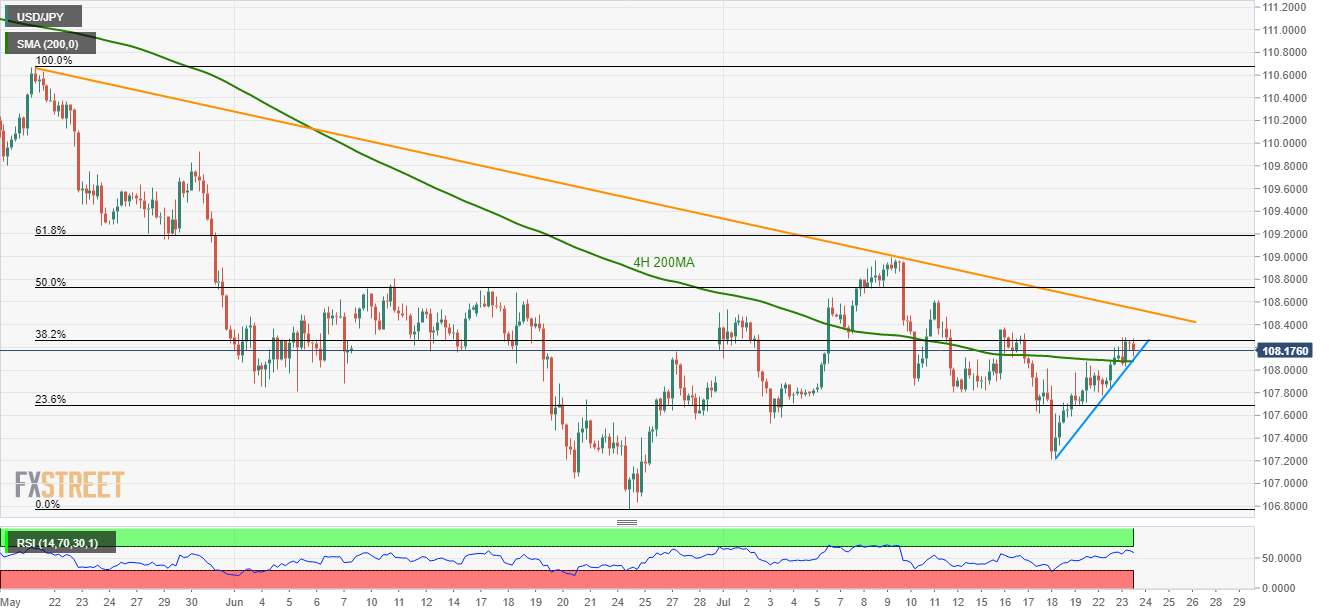
Despite multiple failures to cross 38.2% Fibonacci retracement of May-June downpour, USD/JPY still trades above 4H 200MA and a 4-day long ascending support-line as it takes the rounds to 108.20 on early Wednesday.
While 38.2% Fibonacci retracement limits the pair’s immediate upside, a two-month-old downward sloping resistance-line, at 108.55 now, becomes the key north-side barrier as it holds the gate for the quote’s run-up towards monthly high near 109.00 and then to 61.8% Fibonacci retracement level of 109.20.
On a downside, pair’s decline below 108.10/08 confluence comprising 200-bar moving average (4H 200MA) and near-term support-line, could recall bears targeting 107.55 and the current month low around 107.20.
USD/JPY 4-hour chart
Trend: Sideways