24 Jul 2019
GBP/USD technical analysis: Cable rolling into the Asian session near the 1.2478 level
- GBP/USD is capped by the 1.2510 resistance as the bear trend remains intact.
- The levels to beat for bears are seen at 1.2478 and 1.2435, according to the Technical Confluences Indicator.
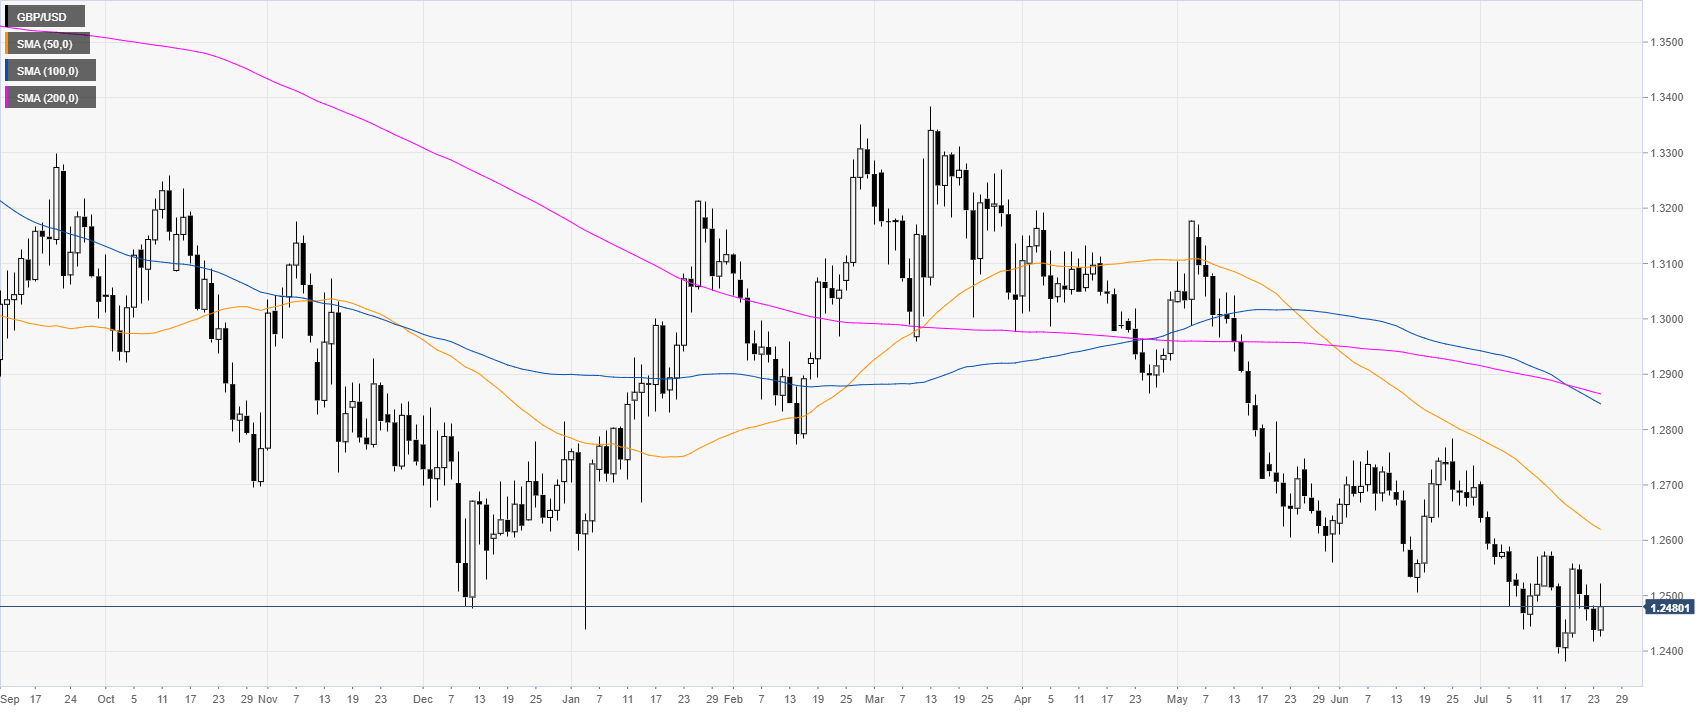
GBP/USD daily chart
Cable is in a bear trend below the main daily simple moving averages (DSMAs). The found resistance near 1.2510 resistance.
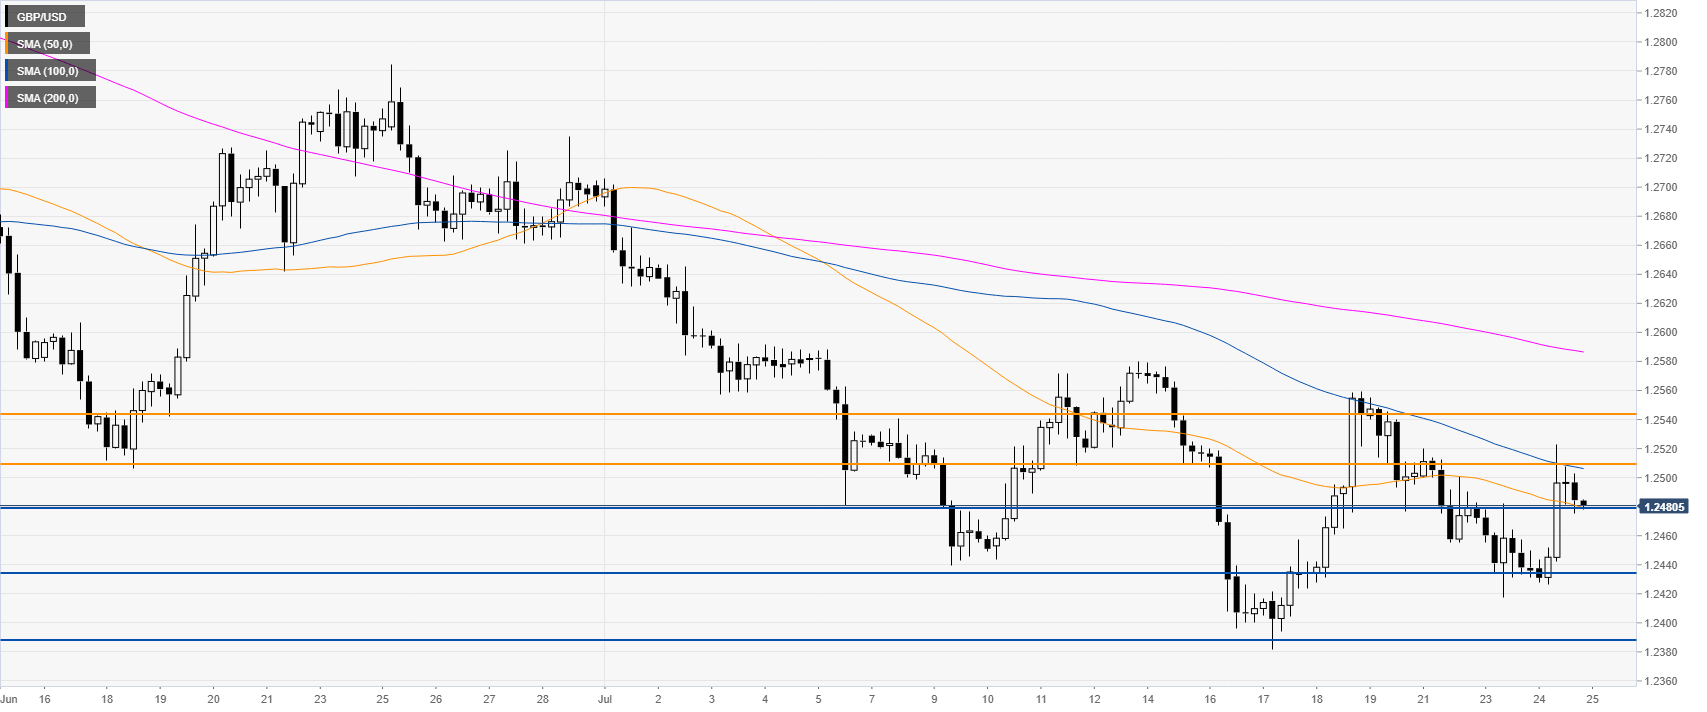
GBP/USD 4-hour chart
GBP/USD is trading below downward sloping 100/200 SMAs suggesting a negative bias in the medium term. Bears need a break below 1.2478 support to travel south towards 1.2435, according to the Technical Confluences Indicator.
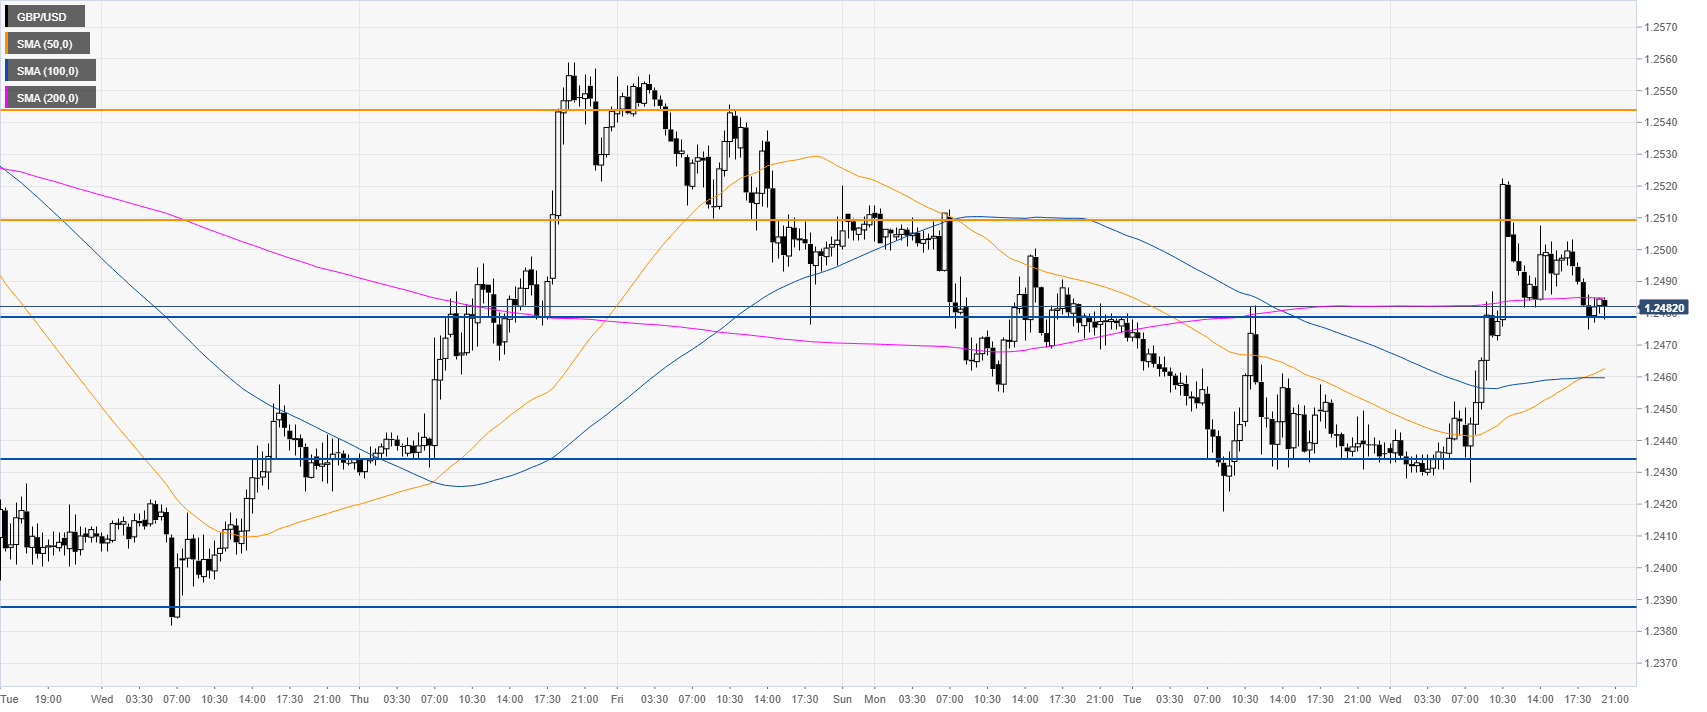
GBP/USD 30-minute chart
GBP/USD is challenging 1.2478 support and the 200 SMA. In the New York session, the market found resistance near the 1.2510 level suggesting that the main bear trend is still intact. Immediate resistances can be seen at 1.2510 and 1.2544.
Additional key levels