EUR/USD: Downside opens up towards 1.2000 as King dollar rules – Confluence Detector
EUR/USD is moving back and forth in a familiar range around 1.2100, lacking a clear directional bias. The upside appears elusive as the US dollar holds onto the recent advance, triggered by upbeat US CPI data. The risk sentiment looks heavier on the session, keeping the safe-haven dollar on the front. However, the major could find some reprieve from the retreat in the US Treasury yields.
How is EUR//USD positioned on the technical graphs?
EUR/USD Price Chart: Key resistance and support levels
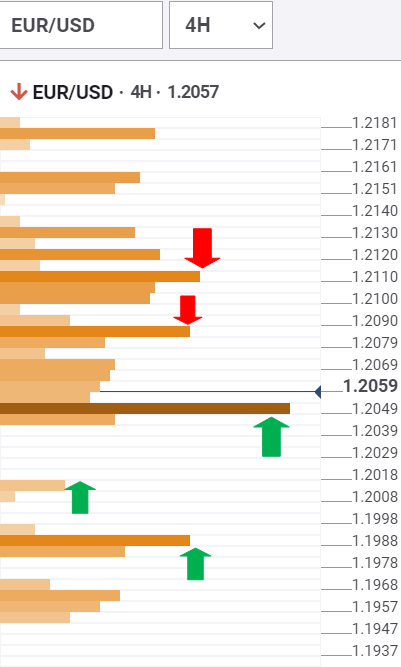
The Technical Confluences Detector shows that EUR/USD is poised to challenge critical support at 1.2049, where the SMA100 one-day converges with the Fibonacci 23.6% one-month and pivot point one-week S1.
A sustained move below the latter could fuel a steep drop towards 1.2015, which is the pivot point one-day S2.
The next relevant support is seen at the confluence of the previous week low and the Fibonacci 38.2% one-month, now placed around 1.1990.
On the flip side, immediate resistance awaits at 1.2090, the intersection of the SMA10 one-day and SMA50 four-hour.
The EUR bulls need to recapture the previous high four-hour at 1.2107 in order to revive the recovery momentum from Wednesday’s slide.
Further up, the 1.2120 upside barrier could challenge the bullish commitments. That level is the confluence of the SMA5 one-day, Fibonacci 61.8% one-day and SMA50 one-hour.
Here is how it looks on the tool
About Technical Confluences Detector
The TCD (Technical Confluences Detector) is a tool to locate and point out those price levels where there is a congestion of indicators, moving averages, Fibonacci levels, Pivot Points, etc. Knowing where these congestion points are located is very useful for the trader, and can be used as a basis for different strategies.