US Dollar Index Price Analysis: 200-HMA challenges weekly support break
- DXY grinds lower around one-week low after two-day fall.
- Bearish MACD signals, trend line breakdown keep sellers hopeful.
- Monthly bottom adds to the downside filters, bulls need validation from 94.40.
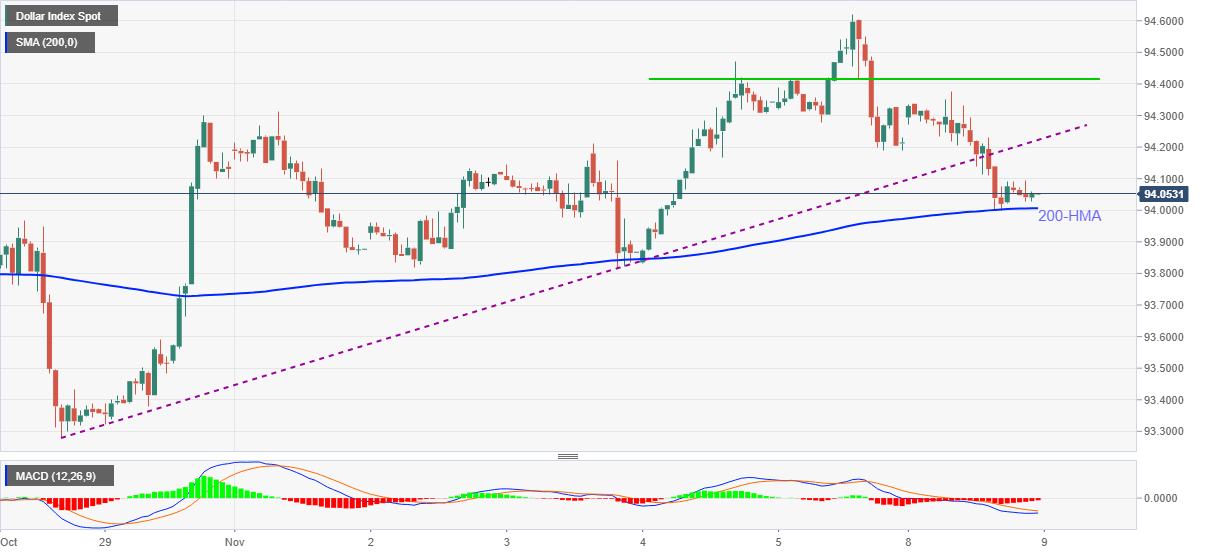
US Dollar Index (DXY) bears take a breather around 94.00 following the last two days’ downtrend. In doing so, the greenback gauge keeps the previous day’s downside break of a short-term support line but struggles to break the 200-HMA support.
Given the bearish MACD signals supporting the trend line breakdown, the quote is likely to break the immediate HMA support near 94.00.
However, the monthly low of around 93.80 will validate the DXY bear’s dominance, which in turn will direct the quote towards the late September’s low near 92.30.
Meanwhile, the support-turned-resistance near 94.25 guards short-term recovery moves of the US Dollar Index ahead of a short-term horizontal area near 94.40.
In a case where the DXY bulls cross the 94.40 hurdle, the yearly high near 94.65 and the September 2020 peak close to 94.75 will be in focus.
Overall, the US Dollar Index (DXY) is likely to witness further weakness but bears need to remain cautious before witnessing the fresh low of the month.
DXY: Hourly chart
Trend: Further weakness expected