Gold Price Forecast: At the mercy of Russia-Ukraine news, key levels to watch – Confluence Detector
- Gold price remains choppy below $1,950, lacking a clear directional bias.
- The Russia-Ukraine updates affect the risk sentiment, gold price action.
- Will gold recapture $1,950 on Russia-Ukraine peace talks 2.0, Powell?
Gold price appears choppy but within a familiar range above the $1,900 mark, as the prevalent risk sentiment remains the main market driver amid incoming updates surrounding the Russia-Ukraine war. Uncertainty over the timing of another round of peace talks, soaring oil prices and global growth worries continue to sap investors’ confidence, diverting the safe-haven flows into the US dollar. Gold traders brace for the US Employment data and Fed Chair Jerome Powell’s testimony for fresh trading opportunities.
Read: Powell Preview: Rethink because of the war? Not so fast, Fed set to remain on track, dollar to rise
Gold Price: Key levels to watch
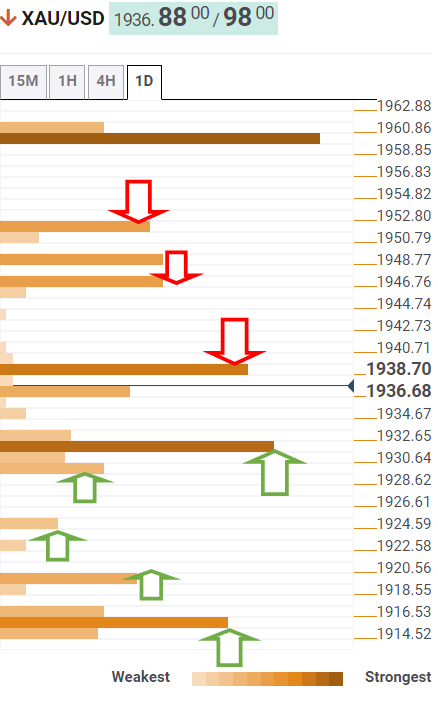
The Technical Confluences Detector shows that gold price has found solid support at $1,931, which is the intersection of the Fibonacci 23.6% one-month and the previous low four-hour.
If the latter gives way on selling resurgence, then the Fibonacci 38.2% one-day at $1,928 could come to the immediate rescue of gold bulls.
The additional declines will call for a test of the SMA10 four-hour at $1,924, below which the Fibonacci 61.8% one-day at $1,919 will help limit the downside.
The level to beat for gold bears is seen at $1,916, where the Fibonacci 38.2% one-week coincides with the pivot point one-day S1.
On the upside, strong resistance is aligned at $1,936, which is Fibonacci 23.6% one-day.
Gold bulls need a sustained break above $1,939 (confluence of the Fibonacci 61.8% one-week, and SMA5 four-hour) to resume the upside towards the $1,950 level.
Ahead of that psychological barrier, the previous day’s high of $1,946 could be tested.
Here is how it looks on the tool
About Technical Confluences Detector
The TCD (Technical Confluences Detector) is a tool to locate and point out those price levels where there is a congestion of indicators, moving averages, Fibonacci levels, Pivot Points, etc. If you are a short-term trader, you will find entry points for counter-trend strategies and hunt a few points at a time. If you are a medium-to-long-term trader, this tool will allow you to know in advance the price levels where a medium-to-long-term trend may stop and rest, where to unwind positions, or where to increase your position size.